User-defined Property
Purpose: Learn to define any property in a database in a format similar to that of the Gibbs energy and plot the contour lines of the defined property on a multi-component phase diagram.
Module: PanPhaseDiagram
Thermodynamic and property Database: AlNi_U.tdb
Batch file: Example_#1.21.pbfx
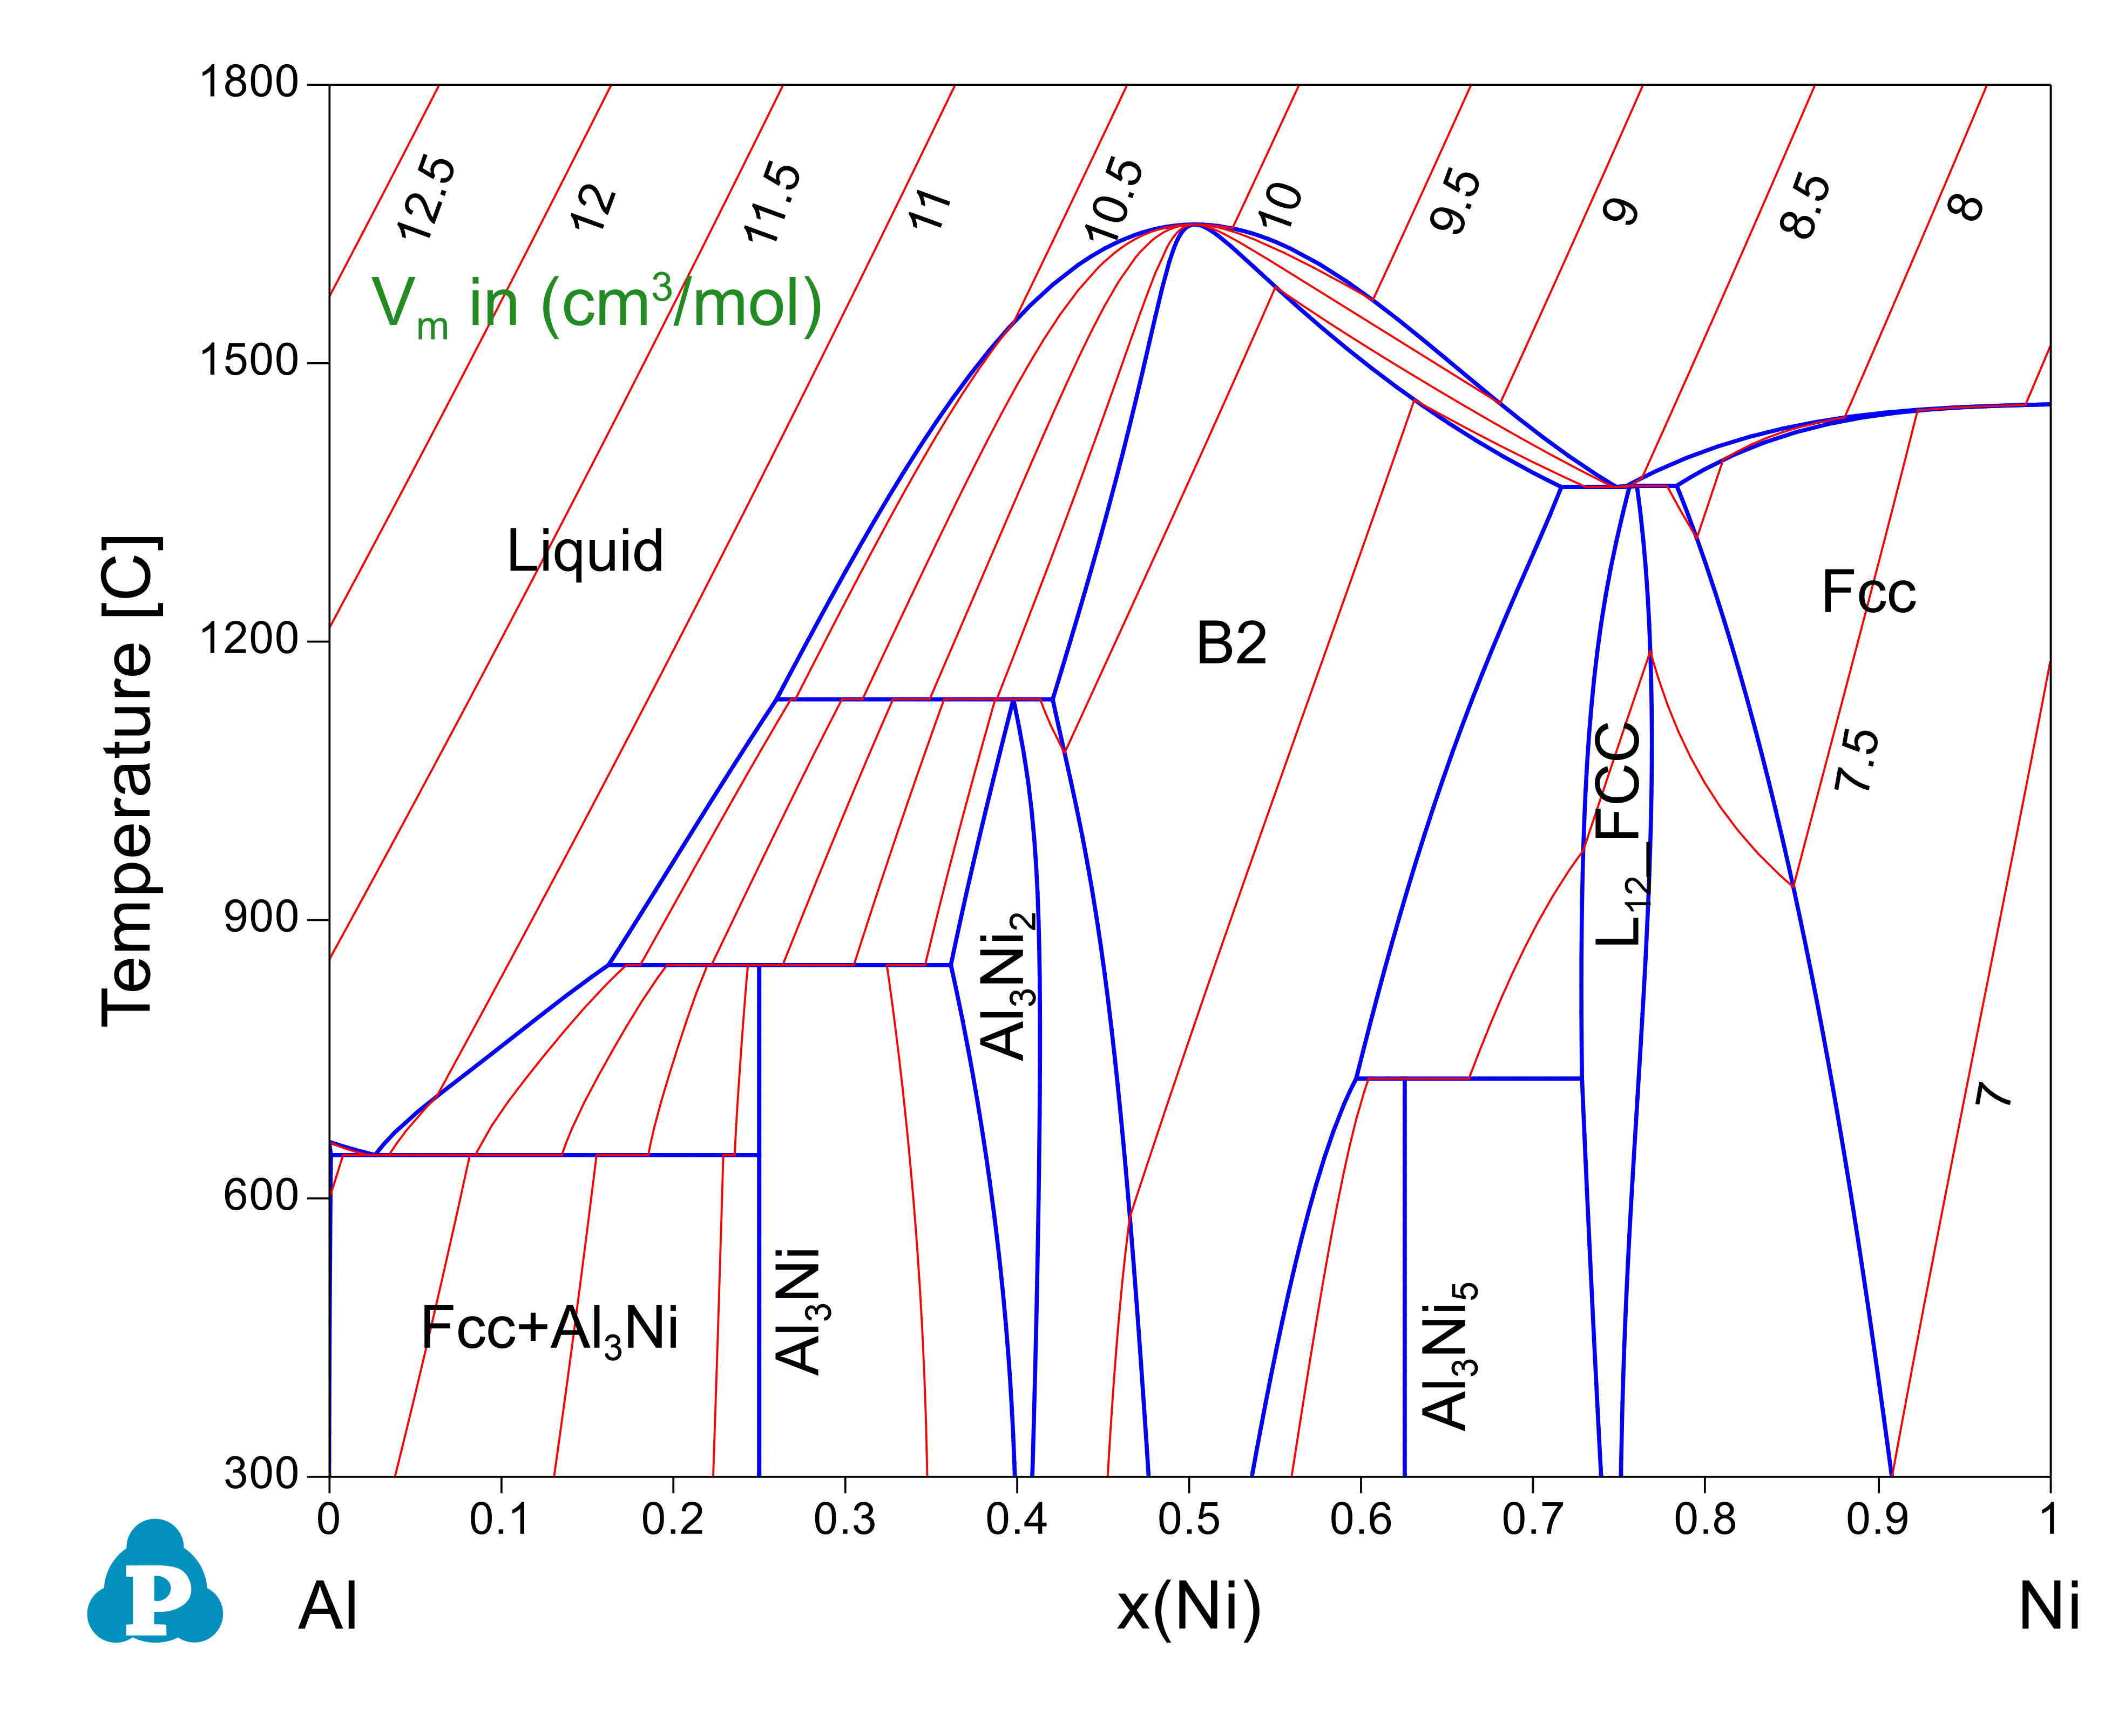
The molar volume of Al-Ni binary system is taken as an example here. Instead of using the specific variable Vm for molar volume, we define a property of U to represent the molar volume. In the database file (.tdb), first define the property U with the keyword “USER_PROPERTY” as
Type_Definition a USER_PROPERTY U 1 !
Then, define the property U as a function of x, the mole fraction, with the keyword “VARIABLE X”:
Type_Definition b GES AMEND_PHASE_DESCRIPTION * VARIABLE_X U !
For any phase with such a property U, include “ab” in the phase definition such as in “Liquid” phase,
Phase Liquid %ab 1 1 !
The parameters for the property are defined in the format similar to that of the Gibbs energy. An example file “AlNi.tdb” is included in the Pandat™ example folder. A batch file “Example_#1.21.pbfx” is also included in the same folder, which produces an identical contour diagram as shown in Figure 1 except that the property name is U instead of Vm. It should emphasize again that U can be any property.
Calculation Procedures:
-
Load AlNi_U.tdb following the procedure in Pandat User's Guide: Load Database , and select both components;
-
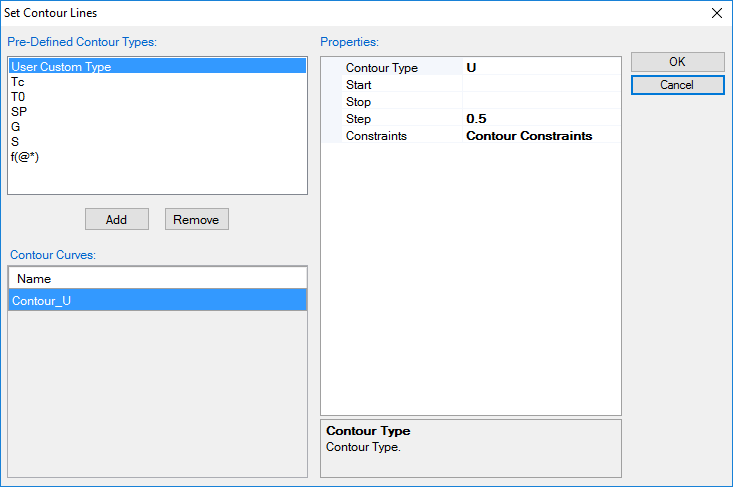
Pop out dialog for Section (2D) Calculation, then click “Contour Lines” to open the contour line dialog as shown in Figure 2;
-
Choose “User Custom Type” and click AddType in “U” for the Contour Type in the “Properties” window as shown in Figure 2.
-
Click OK and perform calculation. The obtain diagram with labeling is shown as Figure 1.